Addendum 1: Scope and methodology
Scope of the Non-financial report
HUBER+SUHNER collects data within the operational scope of the HUBER+SUHNER Group, including its subsidiaries. Our reporting period for social and governance data is the calendar year 2024. The same applies to environmental data; however, in cases of expected disproportionate delays in evaluation, the data for December 2024 were estimated. HUBER+SUHNER estimates the deviation from the calendar year period to be less than ±5 %. We continuously strive to improve data quality and granularity.
Assurance
Ernst & Young Ltd performed a limited assurance engagement on selected EPIs for 2024 (see Addendum 5 : Independent assurance report (EY)).
Social data
The data describing the HUBER+SUHNER workforce reflect the characteristics of the workforce as of 31 December, 2024. The total number of employees includes all individuals with a HUBER+SUHNER contract, including both permanent and temporary employees.
Environmental data
Since 2022, all entities under full operational control of the HUBER+SUHNER Group have at least reported data on energy consumption and employee commuting. Data on raw materials, transport within the Group, customer deliveries, and business travel were sourced from central systems. It is estimated that over 95% [1] of the company’s environmental impact has been captured based on production employee numbers and manufacturing activities. HUBER+SUHNER employs an inventory analysis using input-output models, treating each production site as a unit where energy and materials enter (input) and emissions, waste, wastewater, and products are generated (output).
Life cycle assessment
Since 2009, HUBER+SUHNER has conducted annual life cycle assessment (LCA) to assess its environmental performance quantitatively. Since 2019, it has also evaluated significant environmental aspects as per ISO 14001 standards. This process is outlined in the company’s environmental management procedures and follows the LCA phases defined by ISO 14040.
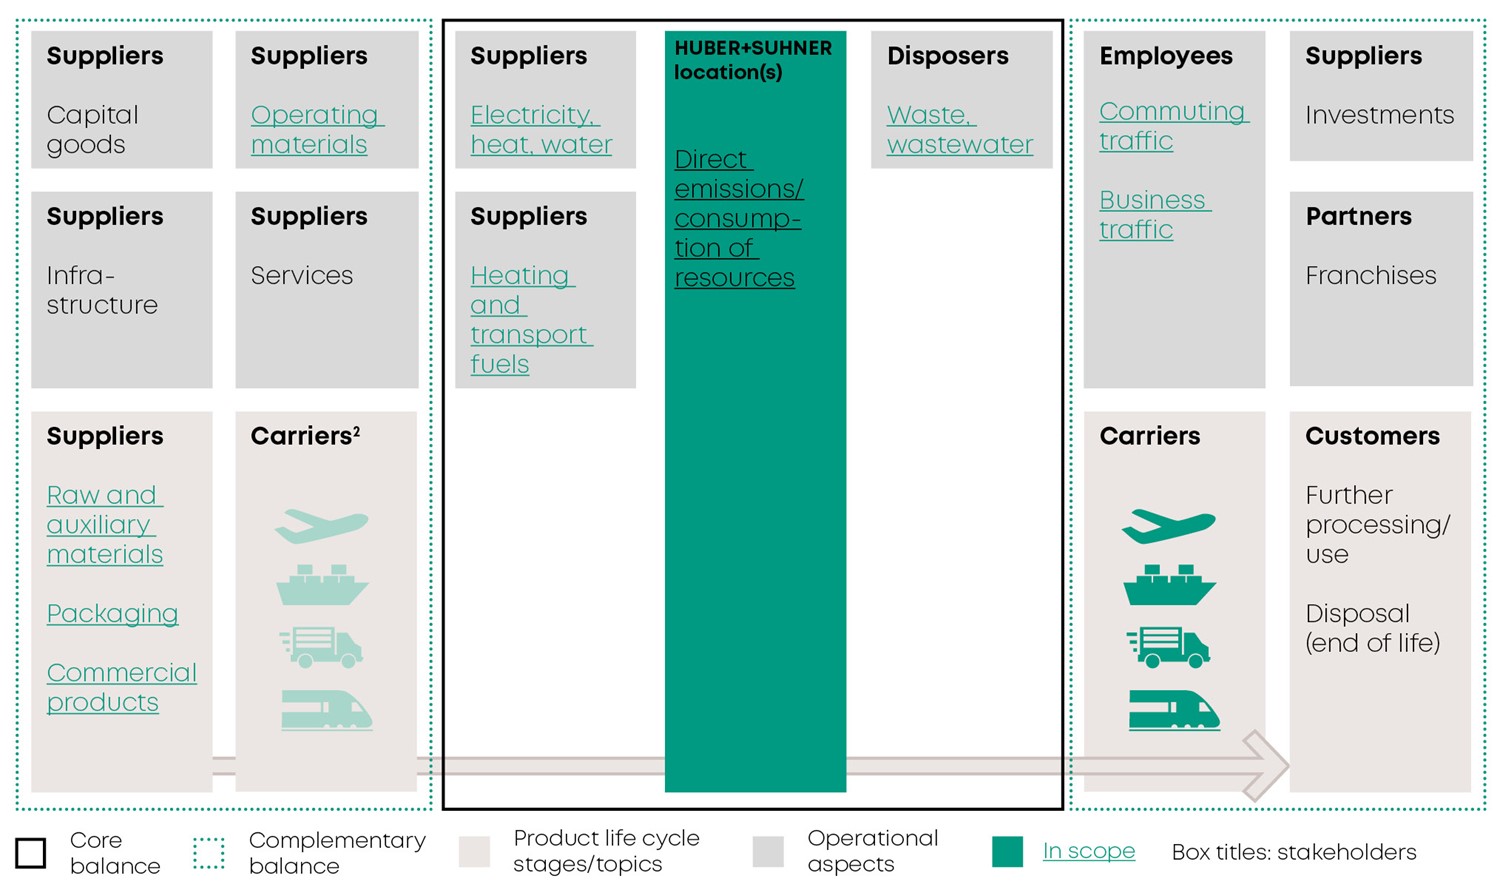
Direct emissions and the consumption of resources as well as electricity, heat, water, heating and transport fuels, and waste and wastewater (core balance) are in scope of the LCA as are raw, auxiliary, operating and packaging materials as well as commercial goods, commuting and business traffic, and the transport of materials and products (complementary balance) as shown in figure 1 below. Materials and commercial goods are sourced from external suppliers, with the exception of certain plastic compounds, which are manufactured at the Pfäffikon, Switzerland compounding facility and processed at the Changzhou, China, and Pfäffikon and Herisau plants in Switzerland. The quantities processed or consumed were taken from the ERP system (purchasing data).
Figure 1: Scope of the LCA
Method
HUBER+SUHNER has delivered all relevant data to sinum AG (St. Gallen, Switzerland), which is responsible for calculating the environmental and carbon footprint. The environmental footprint evaluation is conducted according to ISO 14040. The LCIA method for the environmental footprint is the Ecological Scarcity [2]. The carbon footprint evaluation complies with the World Resources Institute (WRI)/World Business Council for Sustainable Development (WBCSD) Greenhouse Gas Protocol: A Corporate Accounting and Reporting Standard (revised edition). Global warming potential factors aligned with the Sixth Assessment Report of the United Nations Intergovernmental Panel on Climate Change have been used, as recommended by the Greenhouse Gas (GHG) Protocol and CDP; GHGs accounted for were carbon dioxide (CO2), methane (CH4), nitrous oxide (N2O), hydrofluorocarbons (HFCs), perfluorocarbons (PFCs), sulphur hexafluoride (SF6), and nitrogen trifluoride (NF3) as listed in the amended Annex A to the Kyoto Protocol. The footprints were calculated by using expert system REGIS and ecoinvent database version v311. Performance data shown in the environmental performance indicator (EPI) table GRI standards 301, 302, 303, 305 and 306. Intensity data always refer to the added value generated as a measure of the economic performance. The added value has been calculated from profit before tax and depreciation plus personnel costs minus other financial results. The added value for the years 2020–2024 is displayed at the bottom of the environmental performance indicators (EPIs) table.
GHG inventory: screening 2023
In 2023, we conducted a comprehensive screening of all Scope 3 categories, including capital goods, use phase, and end-of-life. Due to significant uncertainty in data quality, these categories have not been reported in our inventory for the time being and are not covered by the SBTi-approved 2030 Scope 3 climate target. We remain committed to improving data quality.