Environment
This section zooms in on the company’s environmental risks and impacts. Supported by facts and figures, it shows how HUBER+SUHNER works to keep its environmental impact as low as possible, while also actively managing the risks and opportunities in the context of the transition to a more environmentally friendly economy. In continuously reducing our environmental impact, we pursue ambitious emission reduction and resource efficiency targets.
Environmental footprint
Since 2009, HUBER+SUHNER has used life cycle analysis (LCA) to determine its environmental performance and significant environmental impacts as required by the ISO 14001 standard. Since 2022, all HUBER+SUHNER sites have reported data on energy consumption and employee commuting. Data on raw materials, commercial goods, internal transport, customer deliveries, and business travel were sourced from central systems. For more details on methodology, please refer to the addendum.
Our LCA establishes the main environmental targets for our production, focusing on the three most critical aspects. We actively manage these issues at all sites, aiming to prevent air, soil and water pollution, and reduce the use and disposal of toxic and hazardous chemicals.
Our environmental impact accounting differentiates between a total balance and a core balance. This complements our greenhouse gas (GHG) inventory (see table 4), which categorises emissions by scope. This distinction helps us understand our operational impact versus our impact across the value chain.
In 2024, we reduced the absolute impact of both balances.
Globally, our main environmental impact comes from sourcing semi-finished goods and materials like copper. In our operations, the main impacts stem from electricity, heating, and disposal.
Table 1: Environmental impact from LCA
2022 | 2023 | 2024 | Change y-o-y [EP] | |||||
Core balance [EP*] | 23 598 | 19 510 | 18 395 | -6 % | ||||
Total balance [EP] | 1 094431 | 1 042 317 | 935 366 | -10 % |
*The life cycle impact assessment (LCIA) was conducted using the internationally recognised Ecological Scarcity Method. This method enables a fully aggregated assessment, represented by a single score indicator: Eco-points (EP), which simplifies both communication and interpretation.
Table 2: Environmental impact distribution
Environmental impact [EP*] | 2024 share (%) | |
Commercial goods** | 44 % | |
Copper | 30 % | |
All other materials | 16 % | |
Transport products | 3 % | |
Transport intercompany | 2 % | |
Paper/packaging | 2 % | |
Electricity | 1 % | |
Commuting | 1 % |
*Eco-points according to the Ecological Scarcity Method [EP].
**Commercial goods refer to third party sourced semi-finished goods
Note: Business traffic, disposal, fuel and heating are below 1 %.
Sustainable products
We continuously explore and adopt safer alternatives to hazardous materials, complying with evolving regulations such as the EU REACH regulation to ensure product safety and environmental protection. HUBER+SUHNER adheres to international standards, including the EU's Restriction of Hazardous Substances (RoHS) and Waste Electrical and Electronic Equipment (WEEE) directives. In line with our sustainability goals, we take proactive measures to ensure compliance with local and global regulations. We work closely with suppliers to align with these regulations and meet our customers’ environmental expectations. We invest in innovation to stay ahead of substance obsolescence, such as lead, and have introduced lead-free connectors. Additionally, we have developed tools to track substances and materials in our products, enhancing transparency and ensuring compliance. These efforts reflect our commitment to environmental stewardship and regulatory compliance.
Resource use
In 2022, we introduced three global reduction targets to monitor resource efficiency as part of our environmental management. These targets include the intensity of total energy consumption, the intensity of waste sent to landfill or incineration, and the total water withdrawal.
We are actively working on reducing material consumption and using more sustainable materials. In 2024, we continued to reduce plastics in our packaging with the introduction of paper bags to replace 3 million single-use plastic bags for fiber optic cables. This change resulted in a reduction of 33 tons of CO2-eq emissions.
Table 3: Resource use targets
Target 2030 (2021 baseline) | 2021 Baseline | 2022 | 2023 | 2024* | y-o-y | 2021-2024 | Status | |||||||
-25 % intensity water withdrawal [m3/million CHF added value] | 2 349 | 2 203 | 1 751 | 610 | -65 % | -74 % | Target reached | |||||||
-15 % energy intensity [MWh/million CHF added value] | 131 | 136 | 136 | 130 | -4.6 % | -0.4 % | On track | |||||||
-25 % intensity waste sent to landfill/incineration [kg/million CHF added value] | 3 632 | 3 346 | 3 739 | 3 667 | -2 % | 1 % | Off track |
* The data on water consumption, energy consumption, and waste was audited through a limited assurance engagement.
Due to the relocation of one of our Swiss sites, we have exceeded our target for water withdrawal for the second consecutive year. Additionally, we achieved a 4.6 % reduction in energy consumption from the previous year and a 0.4 % reduction from our baseline, despite the continuous ramp-up of our energy-intensive production of ADAS antennas in two locations. Despite an overall increase from our baseline in waste sent to landfill/incineration, we managed to reduce this by 2 % from the previous year. With this turnaround, we will continue to focus on targeted local actions to further decrease waste sent to landfill and incineration. Importantly, we also achieved a 10 % year-on-year (y-o-y) reduction in total waste.
See detailed data on energy, water, materials consumption and waste in the environmental performance indicators table.
Climate change mitigation
In our LCA, we also assess our GHG emissions. For details on the methodology, please see the Addendum: Scope and Methodology.
As indicated in Table 4: GHG inventory, the category “purchased goods and services” – particularly the materials we source – accounts for the largest portion of our overall emissions footprint at 82 %. In comparison, our operational footprint is only 3 % of our total emissions.
Due to changes in our data collection method and the inclusion of purchased commercial goods, we recorded growing GHG emissions in Scope 3 until 2022 (see table 5). This process was important to attain reliable and realistic Scope 3 data. To further reduce emissions from our purchased goods and services, we have started integrating climate criteria into our global sourcing process (see chapter Responsible supply chains).
Table 4: GHG inventory
Impact | ||
Scope 1 | 3 150 t CO2-eq | |
Scope 2 (market-based) | 2 978 t CO2-eq | |
Scope 2 (location-based) | 10 016 t CO2-eq | |
Scope 3 emissions | 209 384 t CO2-eq | |
1. Purchased goods and services | 85 % | |
3. Fuel-and-energy related activities | 1 % | |
4. Upstream transport and distribution | 7 % | |
5. Waste generated in operations | 1 % | |
6. Business travel | 1 % | |
7. Employee commuting | 3 % | |
9. Downstream transport and distribution | 2 % |
*In 2023, we conducted a complete screening of all Scope 3 categories (accounting for 97 % of our emissions), including capital goods, use phase, and end-of-life. Due to significant uncertainty in data quality, these categories have not been reported in our inventory for the time being.
To mitigate our impact on global warming, HUBER+SUHNER set targets in 2018 for Scope 1 and 2 emissions validated by the Science Based Targets initiative (SBTi). With the target period ending in 2025, we submitted new targets for all three scopes in July 2024, which were validated by the SBTi in January 2025. The targets, which put us on a trajectory to net-zero emissions by 2050, are summarised in tables 5 and 6 below.
The company remains on track with its Scope 1 and 2 emission targets. GHG emissions in Scope 1 and 2 decreased to 6,128 t CO2-eq in 2024, an absolute reduction of 21 % y-o-y. Most notably this reduction can be attributed to:
- An increase in the share of purchased electrical energy consumed worldwide from renewable sources (hydro, wind, and solar power plants) from approximately 59 % in 2023 to 82 % in 2024
- An increase of 3 % in self-generated renewable electricity through rooftop photovoltaic (PV) panels
- Improvements in leakage prevention have resulted in a significant 62 % reduction in refrigerant loss
- A 12 % reduction in business travel
We are currently not on track with our Scope 3 target due to increasing emissions in the ‘purchased goods and services’ category, originating from project-based business at one of our sites. Emissions from our core business are slightly declining, and this remains our focus of action.
Table 5: 2025 climate target
2025 Target (2015 baseline) | 2015 Baseline | 2022 | 2023 | 2024 | 2015-2024 | Status | ||||||
-50 % emission intensity Scope 1+2* [tCO2-eq/CHF] 1.5°C trajectory | 56 | 23 | 20 | 15 | -73 % | On track | ||||||
-30 % emission intensity Scope 3 [tCO2-eq/CHF] 2°C trajectory | 158 | 415 | 470 | 513 | ** | Off track |
Note: We updated the 2024 background data using v3.11 of the ecoinvent data, released at the end of 2024.
*Market-based approach is used to account for Scope 2 emissions.
**The significant increase in our Scope 3 emissions is primarily due to an expanded scope and substantial improvements in data collection. Consequently, we adopted a new target with a 2023 baseline in 2024.
Table 6: 2030 climate target
2030 Target (2023 baseline) | 2023 Baseline | 2024 | y-o-y | Status | ||||
-55 % absolute emissions Scope 1+2* [tCO2-eq] 1.5°C trajectory | 7 735 | 6 128 | -21 % | On track | ||||
-25 % absolute emissions Scope 3** [tCO2-eq] 2°C trajectory | 189 920** | 209 384 | 10 % | Off track |
Note: We updated the 2024 background data using v3.11 of the ecoinvent data, released at the end of 2024.
*Market-based approach is used to account for Scope 2 emissions.
**We commit to reducing our absolute scope 3 GHG emissions from purchased goods and services, fuel- and energy-related activities, upstream transportation and distribution, waste generated in operations, business travel, employee commuting, downstream transportation and distribution. The target boundary includes land-related emissions and removals from bioenergy feedstocks. The baseline for our net-zero target is 255,625 tCO2-eq and also covers the use-phase. In 2023, we conducted a complete screening of all Scope 3 categories (accounting for 97 % of our emissions), including capital goods, use phase, and end-of-life. Due to significant uncertainty in data quality, these categories have not been reported in our inventory for the time being and are not covered by the SBTi-approved 2030 Scope 3 climate target. We remain committed to improving data quality.
Refer to our environmental performance indicators table for detailed data on our emissions and energy consumption.
Our climate transition plan
In 2024, to curb our emissions in line with our climate targets, we drafted a climate transition plan that outlines our planned actions to minimise our GHG emissions. The climate transition plan is built on the following elements:
Scope 1+2
- Replacement of the remaining fossil-based heating systems with low-carbon alternatives
- Increase in renewable electricity supply to 100 % by 2030
- Installation of rooftop PV panels, where feasible
- Decarbonisation of our fleet by switching to EVs
Scope 3
- Reduction in material consumed, where feasible
- Engagement with suppliers in their climate strategies
- Life cycle assessments of our products
Figure 3: 2030 targets and transition plan
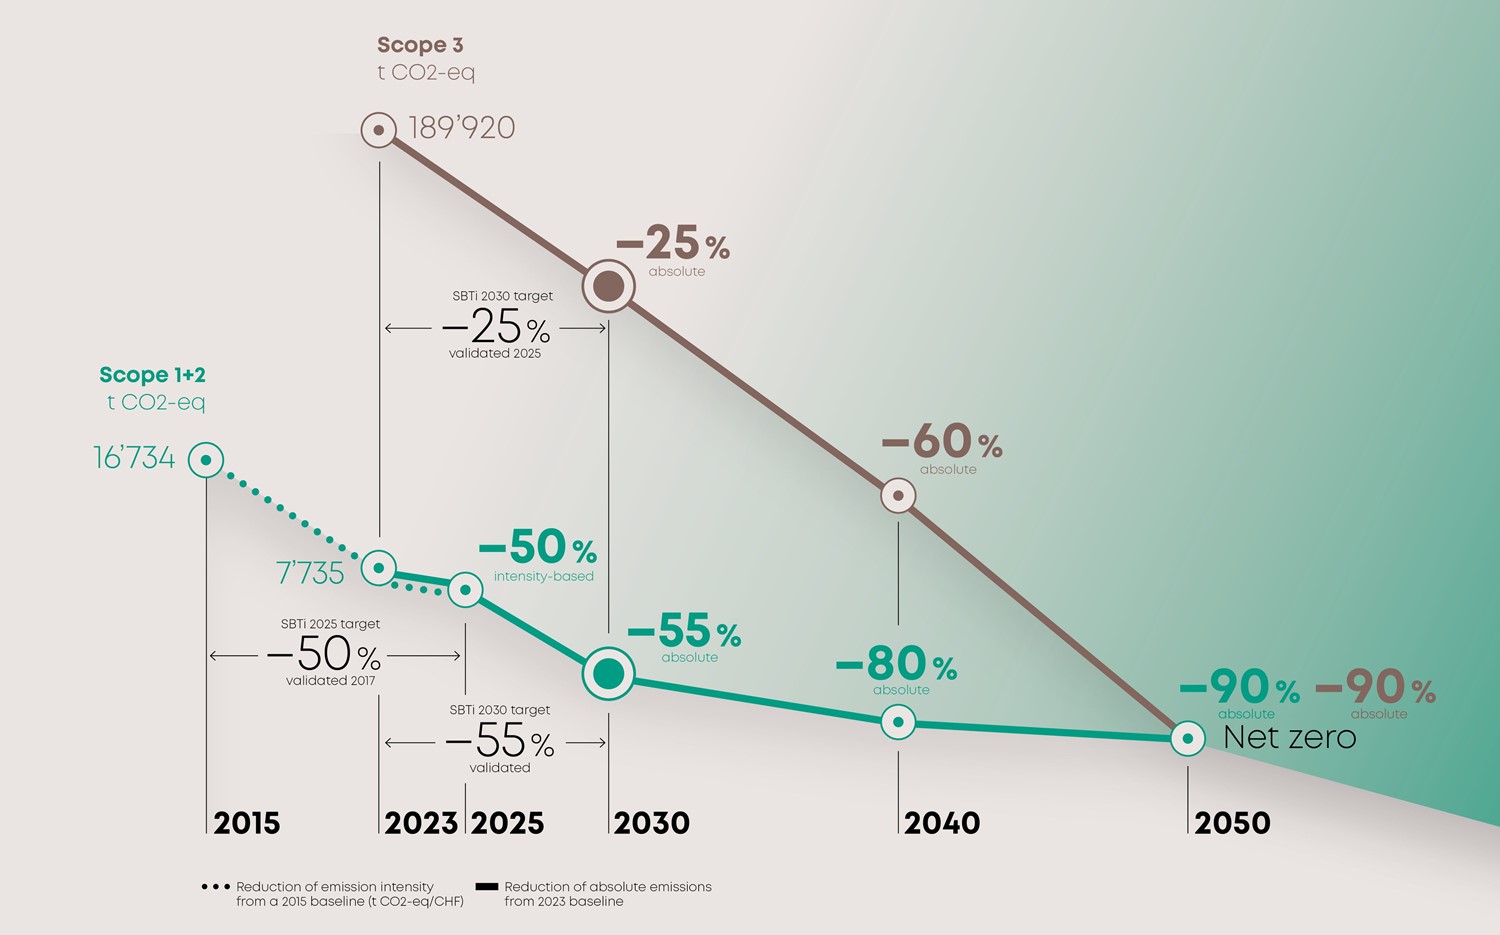
The climate transition plan, which is aligned with our science-based target is available on our website.
Transition risks and opportunities related to climate change
For HUBER+SUHNER, the transition to a low-carbon economy is primarily an opportunity. Our solutions are crucial in enabling this shift. In 2024, 34 % of our revenue came from sectors which are pivotal for the transition to a climate-friendly economy, specifically renewable energies, rail, and EVs.
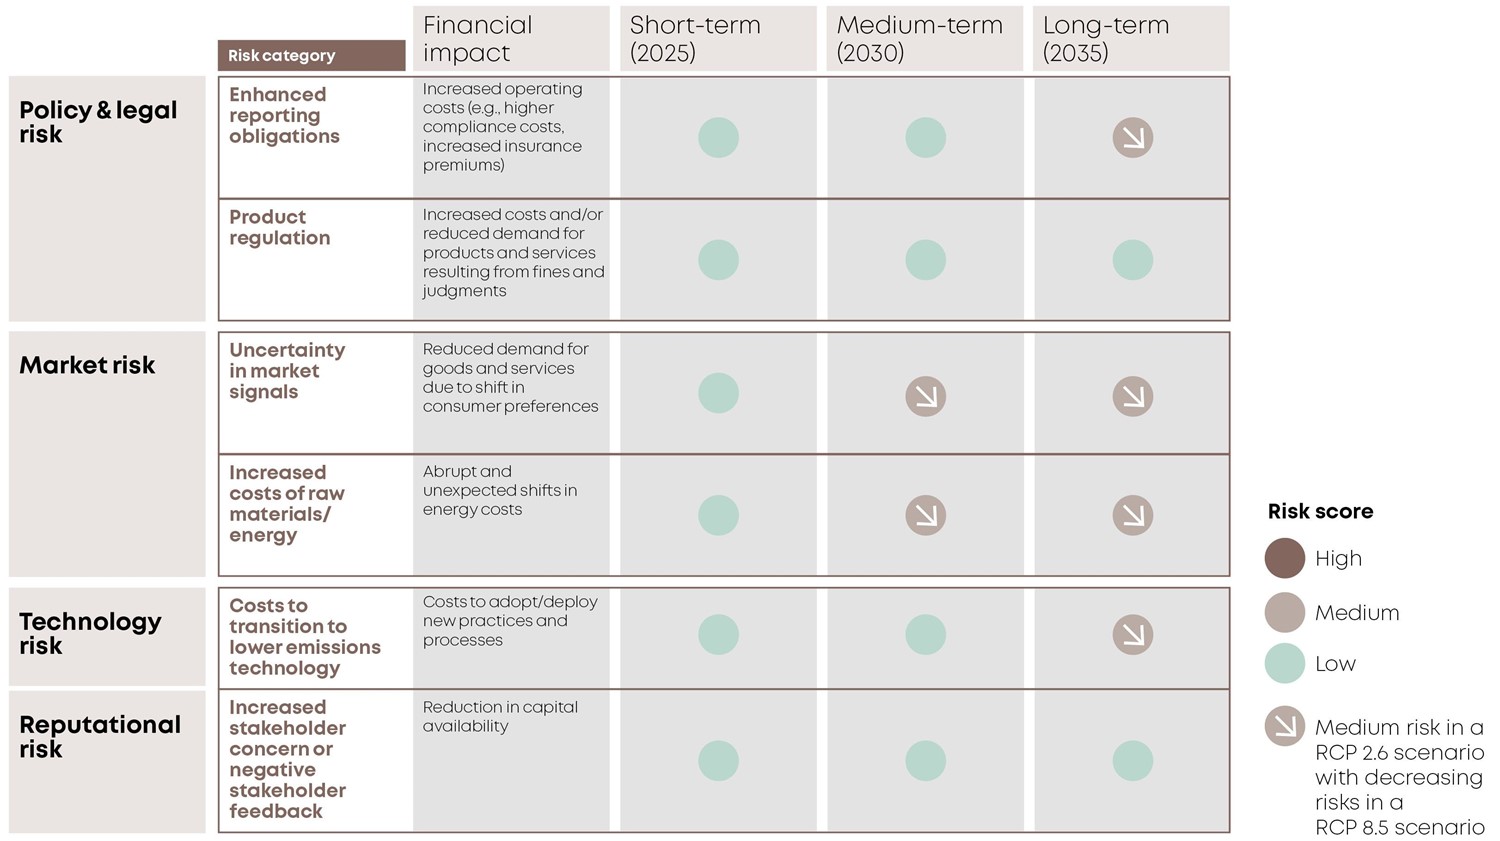
When it comes to transition risks, changing customer behaviour – particularly the rising demand for climate-friendly products and materials, alongside growing costs – could pose medium-term market risks. Therefore, our transition plan enhances our resilience. We actively monitor customer preferences and engage with them proactively. Currently, the aforementioned risks are not material to our business strategy. We assess them using our standard risk management process, as described in chapter Risk management.
Figure 4: Assessment: climate-related transition risks
Physical risks related to climate change
Using our standard risk management framework, we conducted a physical climate risk assessment in 2024, utilising data from Swiss Re, the World Resources Institute, and the Climate Impact Explorer to evaluate potential impacts across various time horizons and scenarios. Initially, we focused on operational risks, with plans to include our supply chain in 2025. The assessment results are displayed in figure 5. We currently see the largest risk from river flooding. However, none of the risks analysed are of material impact to our business strategy. Insights from the site-level assessments were incorporated into local contingency planning where applicable.
Figure 5: Assessment: climate-related physical risks
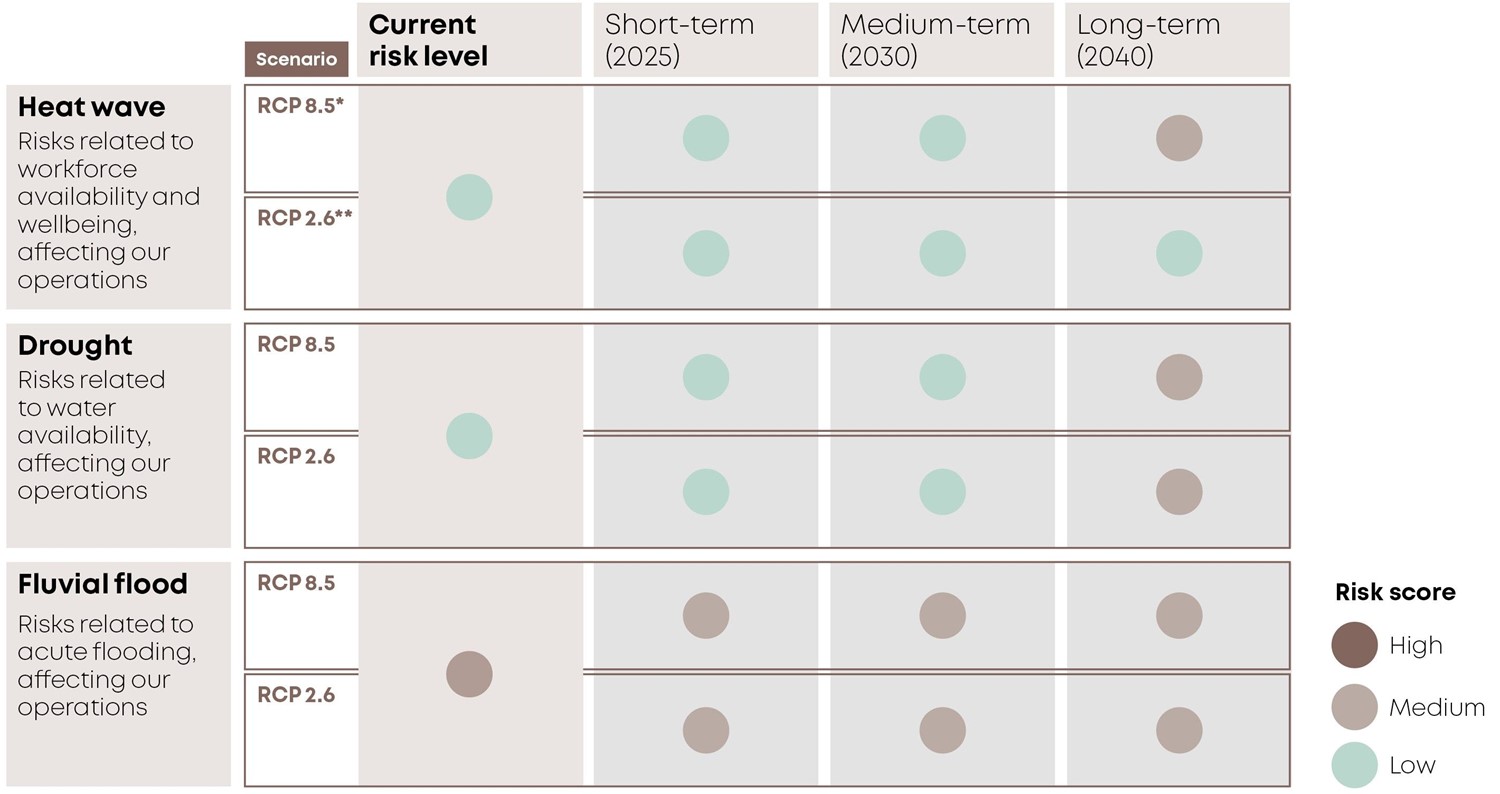
**RCP 2.6 around 1.5-2 °C increase compared to the pre-industrial state. Source: Climate Analytics — Climate impact explorer, Swiss Re CatNet® Risk Assessment Report, and Aqueduct Water Risk Atlas (World Resources Institute).